The Yield Hoe's Notebook

Tuesday, October 24, 2006

What's so fun about FUN?

At 6.9%, with a modest P/E vs it's neighbors, and good growth, Cedar Fair (symbol: FUN) may just put barrel of monkeys to shame. Shares of FUN are like banking on America's appetite for entertainment, which may be greater than or equal to all the stars in the sky; as George Carlin as the mystic Rufus put it in Bill and Ted's Excellent Adventure:

"Hi. Welcome to the future: San Dimas, California --- 2688. And I'm telling you, it's great here. The air is clean, the water is clean, even the dirt is clean! Bowling averages are way up, minigolf scores are way down. And we have more excellent waterslides than any other planet we communicate with. I'm telling you, this place is great!.... If I should fail to keep these two along the correct path, the basis of our society will be endangered. Ah, but don't worry, it'll all make sense. I'm a professional."

This is by no means a sure bet, we know. Witness the recent plight of Six Flags (Sym: SIX), which analysts say had let its operations slip into something more like fly by night carnival than say, a Disney production (Sym: DIS). There turn around story is pinned on the hope that families will see that they are serious about good clean family fun, vs. the other kind..

So is collecting almost 7% from all this fun TGTBT?
FUN owns and operates 12 amusement parks, and revenues are down on the year as the result of its indoor water park in Sandusky. At 21%, it has lower than average institutional ownership base, which is 49% It is trading at it's 200 day moving average, so there is no bargain to be had by plouging in just now.

FUN's peer group includes everything from cruise lines to fitness companies to race tracks to DVD rental companies. The big players are cruise lines, including the Carnival (CCL) and Royal (RCL) and Warner Music (WMG); and the smaller market cap companies include Six Flags (SIX), World Wresteling (WWE), Blockbuster (BBI). and AMF Bowling (AMBWQ). How does FUN compare, is the question; and if you look at net margins, you'll get a pretty clearn answer-- FUN looks very good at 27.9% with it's 565 million revenues, and with a P/E ration of 9.5 vs. say 18 at Carnival, or Vail Resorts at 5.5% net margin and with a P/E of 33.

Of course, there is Littlefield Corporation with a net margin of 13% trading at a p/e of 4.2 from it's Bingo Hall development business, but does LTFD, which also trades on the OTC Bulletin boards yield what FUN is passing out to shareholders. No, it does not. Speedway Motorsports also has a nice margin and a p/e on the low end, but does it yield what FUN yields. No. So, FUN looks good from a couple of angles.

What about revenue growth? Well, the neighborhood looks a little tight, like a group of row houses in Queens anyway; but more than half appear to have bad EBITD margins and are also not growing at any notable rate. So FUN looks good, by comparison anyway.

FUN also looks good in other respects when held up to other companies in its industry. FUN trades below the industry averages of trading prices to sales, to book values and to cashflows. And dramatically so. For example, FUN Beta is just .5 vs an industry wide Beta of 1.2. Here are more: it's P/E of 9.5 is almost half of the 18.8 for the industry. Price to cashflow is 6.8 is almost half of the industry's 12.3, and it looks even better when held up to its sector.

Revenue growth is slight, but so is the group, save the direct DVD mail, bingo halls and speedway companies (NFLX, LTFD and TRK), which there again, do not pay investors to wait. FUN also leads the pack when it comes to it's profit margins vs. its own 5 year average profit margins. so it looks good vs. its past 5 years.

FUN has a return on equity of near 50%, which leads the field, but its total debt to capitalization approaches 60% too, which is on the high side of its peer group. Since 1998, admission have increased every year-- "no way? yes way!"

So, there is a joke about rollercoasters and stock charts in here somewhere, but we'll leave it to you to find it, just as we'll leave it to the reader to make up his or her mind about the tradeoff for FUN, which gives shareholders almost 7% to wait from a business that looks pretty good from most angles vs. its peer group of cruiselines, DVD rentals companies, speedways, fitness centers and bingo halls out there. It's not really trading at a discount to its moving averages at this level, but it may be worth watching and waiting for a pullback to plough in, but don't quote the yield hoe on that. As always, the moves you make in the securities markets are your own, so choose wisely, and remember, it's ready, aim, fire-- not fire, ready, aim.


Sunday, October 08, 2006

What is High Yield? Tax Equivalent Yield at the 5.68% Level

So what is "high yield"? Rather than looking at "Junk Bonds" and other exotic bargains, looking at run of mill, lower yielding secuirties my help put a finer point on the theme of The Yield Hoe, and considering after tax returns may make it even more clear.

It's benchmark time, which is to say it's time to review yields and the risk tradeoff for various securities "out there". A good place to start is to look at the tax equivalent yields on municipal bonds, which are nearly risk free of default vs. other taxable government securities, which are totally risk free (treasury bills, notes and bonds). The question is how do muni yields stack up to the yields on other bonds. So it's best to look at non government bonds too, which are not so free of default risk (asset backed, corporate bonds and notes-- think Enron bonds).

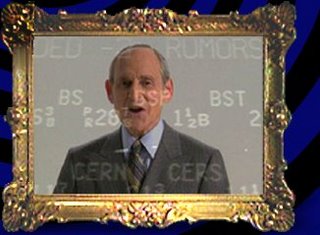
What sets Munis apart is a return that is free from federal, state and local taxes (in most cases). For a quick review, see "Poppy" Lebenthal's outstanding, memorable and low budget TV commercials touting Municipal bonds, or as he put it, "not paper", but the "tunnels and waterworks, the nuts and bolts that make New York work!" (shot by AMI). Note the double breasted suit, and the 6.25% yield on the 10 year.

The best place to look for this information in my book (or blog) is the Rates page on "Bloomie", or Bloomberg.com. The page will show you what all types of bonds are yielding, including municipal bonds, along with graphical yield curves for each, or charts showing the various yields of these bonds over different terms. Of course, there are a few othere places to look online
if you want to drill down into the current yields on Munis, including The Bond Market Association's investinginbonds.com, which also has a calculator showing state specific yields, as well as The Bond Buyer

So what's showing? Right now, minis are yielding in the neighborhood of 3.69% range on the so called shoulder of the curve, or 7 years out, meaning you can park your cash into a portfolio of 7 year munis and can expect to earn 3.65 to 3.70% per year. Before you snicker such low returns, consider what you'll keep.

Other taxable bonds are yielding 5.19%, which is less than you'll earn on Muni bonds from an after tax point of view if you pay 35% tax on ordinary income. After the tax chop, you'd have to earn more than 5.68% after tax to beat Muni bond yields. If you can not find an investment that yields more than 5.68% with a very very good chance of continuing to pay its dividend, then experts will tell you that Munis are a better alternative to most government bonds, which yield less after tax time.

There is, of course a formula to find the "tax equivalent yields" of Municipal bonds versus other debt and dividend paying securities. There are also very good online calculators that yield investors should bookmark for the purpose, here, here, and here.

The formula as furnished by Moody's is as follows:

Tax equivalent yields when you want to compare a municipal/non taxable return with that of a taxable bond. To do that, take the municipal bond yield and divide it by 1 minus the taxpayers tax bracket

6% municipal yield

30% investor tax bracket

.06/1-.30= .06/.7= 8.57% That means, everything else being equal (it never is, though) that it would make no difference to an investor buying either a 6% tax free bond or a taxable 8.57% bond since they would both produce the same net return. (I have not addressed other issues of risk, however.)

Still not jazzed by 3.68% after taxes? Consider the risks too. Munis, almost like treasuries just don't default. While credit ratings change, and yields adjust higher for more risk, they nearly never default, leaving no risk to the money you park there if held to maturity.

Still not sold on munis? And "10 NY Tribes" just have the appeal of cold grits in your mouth? Well, then, you're in the right place. We jackasses too search for greater gains from securities
offering higher yields. But more than this, it's important to see if there is a very very good chance that they continuing to pay dividends at these higher levels, wherein, doth sit the dread and fear of kings. So you'll always have to decide for yourself whether it is really worth parking your cash into something that is almost by definition more risky to your money than municipal bonds, but perhaps less risky than betting 10 dimes on the Bears, no matter how good they look.

Municipals nearly never default; and while treasuries have never defaulted-- 0%, "nearly" her means a less than 1% default rate, so it's pretty damn close to "riskless".

There aren't many companies with such a track record with dividends that safe, and so it is important that investors insist on being compensated for the added risk they take when reaching for high yield investments, greater than the tax adjusted yields of municipals (5.50 to 6% in the current market).